Watch what you pay at the pump
ZATO’s fuel price trend charts the price you actually paid per litre or gallon at every fill-up, per fuel type, with your latest, average, lowest and highest price and how much it changed over the period.
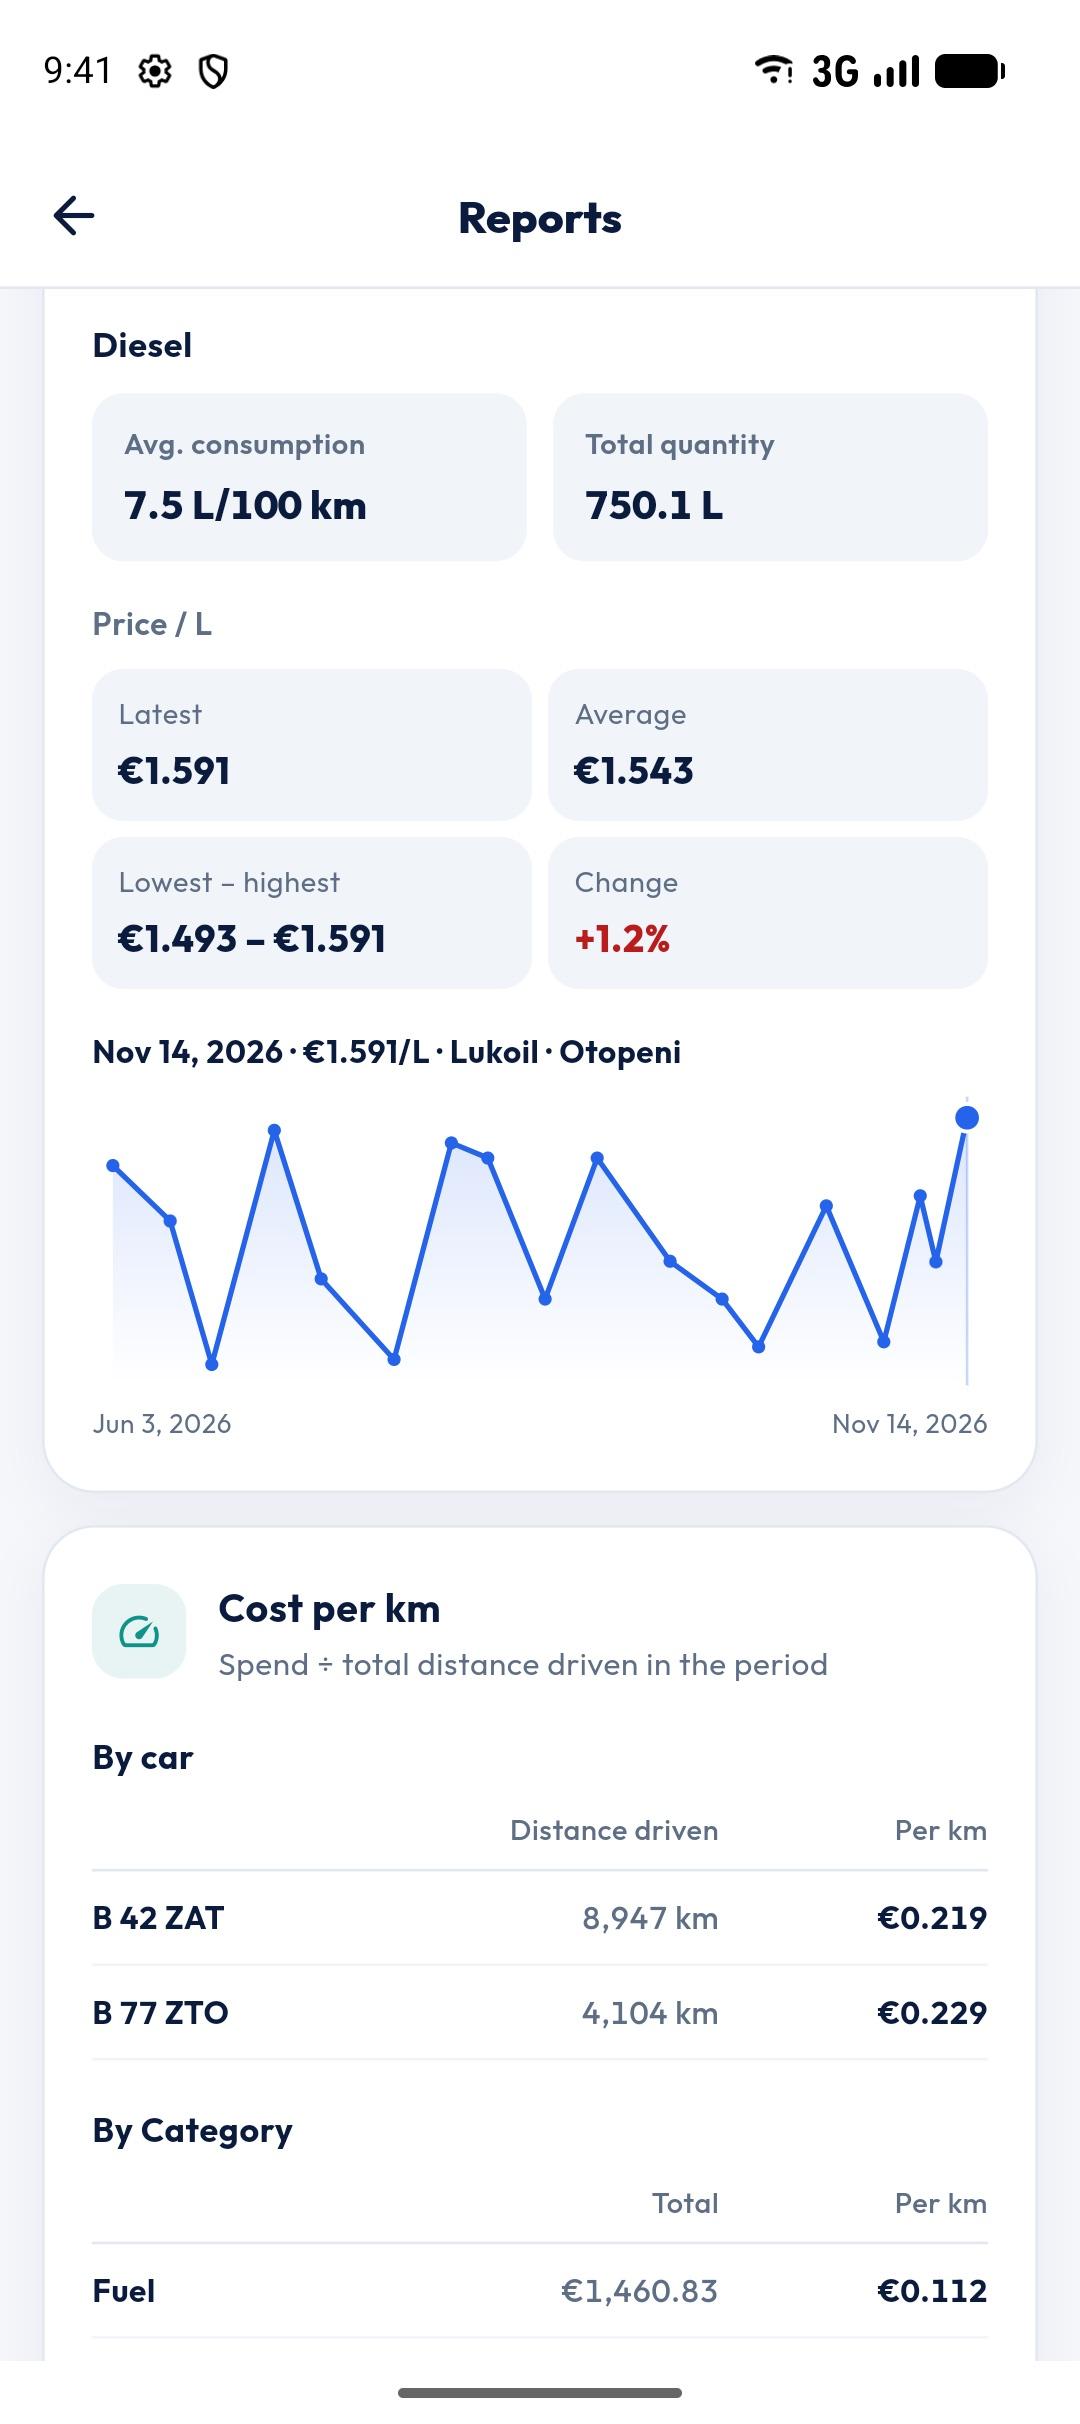
- Per
- Fuel type
- Shows
- Latest · Avg · Min · Max
- Change
- % over period
- Source
- Your fill-ups
Your real prices
Not national averages — the price from each of your own receipts.
Spot the cheap stations
Tap any point to see that fill-up and compare where and when you paid least.
Every fuel separately
Diesel, petrol, LPG, CNG and electricity each get their own line.
Why it matters
Fuel is usually the largest running cost of a car. Seeing the price you pay over months makes it obvious when a cheaper station or a different day of the week pays off.
Part of Reports
The fuel price trend lives in Reports next to consumption and spending, and respects the same period and car filters.
Questions about fuel price trend
Where do the fuel prices come from?
From your own fill-ups: the price per unit you entered or scanned from the receipt.
Can I compare diesel and LPG?
Yes, each fuel type has its own trend.
Is it free?
The fuel price trend is part of ZATO Pro Reports. Every new account gets 90 days of Pro free, no card needed.
Works well with
- Fuel log & calculatorLog every fill-up in seconds: enter any two of litres, price per litre and total — ZATO calculates the third. Gasoline, Diesel, LPG, CNG, Electric.
- Fuel consumptionSee your car’s real fuel consumption in L/100 km or MPG, measured full tank to full tank, per car and per fuel type. CNG and EVs too.
- Car cost reportsMonthly spending vs last year, categories, cost per km, fuel stats and a year-end estimate — clear car cost reports for any period.
See what your car really costs.
Expenses, reminders, documents and driver chat — on Android and at app.getzato.com. 90 days of Pro free.
